

Every growing enterprise generates a vast amount of operational and financial data. Modern digital tools track every website click, inventory movement, sales call, and payroll expenditure. However, having access to an overwhelming volume of information does not automatically lead to better strategic decisions. Many organizations fall into the trap of tracking everything that can be counted rather than measuring what actually drives enterprise value.
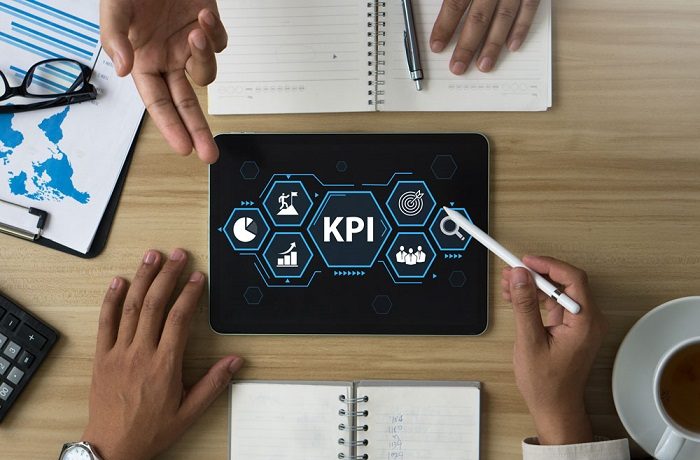
Key Performance Indicators, commonly known as KPIs, serve as the navigational instruments of an organization. When chosen correctly, they cut through operational noise, provide objective clarity on organizational health, and align cross-functional teams toward shared strategic goals. Measuring business performance effectively requires understanding the difference between vanity metrics and actionable indicators, establishing balanced measurement frameworks, and integrating data into daily managerial decision-making.
Understanding the Difference Between Metrics and KPIs
While the terms metric and KPI are frequently used interchangeably in casual workplace discussions, they represent distinct concepts within strategic management.
A metric is any quantifiable measurement of a business activity. Examples include total website visits, raw output from an assembly line, the number of emails sent by a marketing team, or total customer support tickets logged. Metrics provide contextual operational data, but they do not necessarily indicate whether a business is progressing toward its overarching objectives.
A Key Performance Indicator is a selected, high-priority metric that directly reflects the success or failure of a core business objective. A metric becomes a KPI only when it has a defined target, is tied to a specific strategic goal, and triggers operational decisions when performance deviates from expectations. Tracking too many metrics dilutes leadership focus, whereas focusing on a curated set of high-impact KPIs drives operational accountability.
The Pitfalls of Vanity Metrics vs Actionable Indicators
One of the most common errors in business performance measurement is the reliance on vanity metrics. Vanity metrics are data points that look impressive on paper, make teams feel productive, but offer no actionable insight into financial health, operational viability, or customer satisfaction.
Common examples of vanity metrics include:
-
Total registered users without accounting for active, recurring platform usage
-
Social media follower counts and raw impressions that do not convert to sales pipeline
-
Gross transaction volume that ignores steep discounting, high return rates, or negative profit margins
-
Total page views that fail to measure bounce rates or lead generation
In contrast, actionable indicators provide clear diagnostic insight. They answer critical operational questions and point toward specific corrective steps. An actionable KPI demonstrates cause and effect, allowing leadership to understand which inputs drive positive commercial outputs.
Designing a Balanced KPI Framework
Relying exclusively on a single category of performance indicators creates dangerous blind spots. A company that tracks only short-term profitability may sacrifice long-term customer retention or employee satisfaction to hit quarterly targets. A sustainable performance measurement framework evaluates the enterprise across multiple operational perspectives.
Financial Performance Indicators
Financial indicators reflect the economic consequences of all operational activities. They confirm whether commercial efforts are converting into sustainable cash flow and enterprise value.
-
Operating Cash Flow: Measures the cash generated by core business operations, showing whether the company can sustain itself without continuous external financing.
-
Net Profit Margin: The percentage of revenue remaining after all operating expenses, interest, and taxes are paid, illustrating overall cost control efficiency.
-
Customer Acquisition Cost: The total marketing, sales, and promotional spend required to win a single new customer.
-
Customer Lifetime Value: The total gross profit a business expects to earn from a single customer relationship over its entire duration.
Customer and Market Health Indicators
A healthy business requires a loyal, expanding customer base. Tracking customer-centric KPIs provides early warning signs of product degradation or competitive vulnerability.
-
Net Promoter Score and Customer Satisfaction: Standardized benchmarks that measure customer sentiment, loyalty, and likelihood to recommend the brand.
-
Customer Churn Rate: The percentage of customers or subscribers who cancel or fail to renew their relationship within a given time period.
-
Cohort Retention Rate: Tracking how specific groups of customers behave over time, highlighting whether product improvements are increasing long-term engagement.
Operational and Process Efficiency Indicators
Internal process indicators evaluate how efficiently an organization converts raw inputs, capital, and labor into delivered goods or services.
-
Inventory Turnover: The rate at which inventory is sold and replaced over a specified period, preventing capital from being trapped in obsolete stock.
-
Capacity Utilization: The percentage of potential production or service capacity currently being utilized, highlighting operational bottlenecks or underutilized assets.
-
Order Fulfillment Cycle Time: The total time elapsed from the moment a customer places an order to the moment of delivery, reflecting supply chain efficiency.
Employee Engagement and Organizational Health Indicators
Human capital drives operational execution. Ignoring workforce health inevitably degrades customer service and product quality.
-
Employee Turnover Rate: The proportion of employees leaving the organization, highlighting potential cultural or management challenges in specific departments.
-
Revenue Per Employee: A high-level measure of overall workforce productivity and organizational efficiency.
-
Time to Hire and Ramp-Up Speed: Measures how quickly an organization recruits talent and gets new team members fully productive.
Balancing Leading and Lagging Indicators
A sophisticated KPI architecture requires a deliberate balance between lagging and leading indicators.
Lagging indicators measure outcomes after the events have already occurred. Financial statements, quarterly revenue, annual churn rates, and total net profit are classic lagging indicators. They provide definitive historical records of past performance. The primary drawback of lagging indicators is that by the time data is collected, the outcome is fixed and cannot be changed.
Leading indicators measure dynamic activities and operational inputs that influence future outcomes. For example, the number of qualified sales discovery calls completed this week is a leading indicator for next quarter closed revenue. Pipeline velocity, customer onboarding completion rates, and weekly active software usage act as early predictive signals. Tracking leading indicators allows managers to make tactical adjustments before negative trends materialize on the financial ledger.
Establishing Effective KPIs: Step-by-Step Selection
Choosing the right KPIs requires methodical alignment with business goals rather than adopting generic industry templates without customization.
-
Tie Every KPI to a Strategic Priority: Start with the strategic plan. If the annual objective is international expansion, relevant KPIs should focus on regional market penetration, localized customer acquisition costs, and cross-border fulfillment timelines.
-
Apply Strict SMART Criteria: Ensure every KPI is Specific, Measurable, Achievable, Relevant, and Time-bound. A vague objective like “improve customer service” must be defined as “reduce average first-response resolution time to under four hours by the third quarter.”
-
Establish Clear Ownership: Every single KPI must have an individual owner who is accountable for reporting the metric, analyzing variances, and coordinating corrective action when targets are missed.
-
Set Realistic Baselines and Thresholds: Review historical data to set realistic performance targets. Establish acceptable tolerance bands rather than single rigid numbers to account for routine operational variance.
-
Maintain Simplicity: Limit the number of primary organizational KPIs to between five and eight core indicators. Overburdening teams with dozens of secondary metrics causes analysis paralysis.
Integrating KPIs into Daily Management Workflows
Selecting the correct indicators is only the initial step; the true value comes from using data to drive operational decisions.
Organizations should build real-time visual dashboards that present key indicators clearly, using color-coded performance thresholds to highlight anomalies instantly. Furthermore, management rhythms must incorporate data reviews into regular operational check-ins:
-
Weekly tactical reviews to examine leading indicators and address immediate operational bottlenecks
-
Monthly operational meetings to evaluate progress against quarterly targets and allocate departmental resources
-
Quarterly strategic reviews to analyze lagging indicators, evaluate broader market trends, and refine KPI targets as necessary
Creating a Data-Driven Culture of Accountability
Measuring business performance with the right KPIs transforms subjective workplace opinions into objective operational clarity. By establishing a balanced scorecard that tracks financial vitality, customer satisfaction, operational efficiency, and organizational health, leadership teams gain a true reflection of enterprise performance. When organizations eliminate vanity metrics, balance leading and lagging indicators, and embed data into daily workflows, they build resilient, scalable businesses capable of thriving in any economic climate.
Frequently Asked Questions
How many KPIs should an organization track at one time?
At an enterprise level, leadership should focus on five to eight primary KPIs that represent overall business health. Individual departments should track three to five functional KPIs tailored to their specific operational responsibilities. Tracking more than this creates cognitive overload and dilutes strategic focus.
What is the most common reason KPI implementations fail in growing companies?
KPI implementations most often fail due to a lack of clear ownership and poor data hygiene. When no specific individual is responsible for analyzing a metric, or when team members do not trust the underlying accuracy of the data collection systems, dashboards are ignored and decision-making reverts to intuition.
How often should a company update or change its KPIs?
Core financial and customer retention KPIs typically remain stable for years. However, tactical and operational KPIs should be reviewed annually during strategic planning or updated whenever a business model shifts, such as transitioning from an enterprise licensing model to a recurring subscription framework.
How can a business measure qualitative performance, like company culture or brand perception?
Qualitative attributes can be measured by converting subjective sentiment into standardized quantitative scores. Tools like anonymous employee Net Promoter Scores, pulse surveys, 360-degree leadership evaluations, and social media sentiment analysis indices provide reliable numeric benchmarks for qualitative performance.
What is the difference between a KPI and an Objective and Key Result?
An Objective and Key Result is an overarching goal-setting framework that defines a qualitative destination (the objective) alongside quantitative milestones (the key results). A KPI is an ongoing, continuous operational measurement used to track the health of a specific process or business function over time.
Can tracking the wrong KPIs damage employee morale and productivity?
Yes. When employees are evaluated on poorly designed metrics, it often incentivizes counterproductive behavior. For instance, evaluating customer service agents solely on short average call handle times can encourage staff to hang up on complex customer issues rather than resolving their underlying problems.
How do seasonal fluctuations affect KPI evaluation and target setting?
Seasonal industries must benchmark performance against year-over-year cohort comparisons rather than month-over-month trends. Setting quarterly targets that account for historical seasonal demand patterns prevents teams from mistaking predictable cyclical dips for operational failure.